Teaching Statistics to People Who Were Scared of It
Graduate Teaching Assistant for COE 502 Introduction to Data Analysis, Spring 2025. I led weekly SPSS labs, taught full sessions, and graded assignments for a cohort of graduate students across 19 modules of applied quantitative methods.
COE 502: Introduction
to Data Analysis
Three Jobs in One Room
I was not just grading papers in the back. My role had three distinct modes that I switched between across every class session and the time between them.
Lab Instructor
Every class session, after Dr. Beardsley finished the theoretical portion, I took over and led the SPSS lab. I walked students through importing data, running the appropriate procedure, interpreting the output window, and catching the errors they made along the way. I designed the lab exercises to directly mirror what was just taught so that the gap between theory and practice was as short as possible.
Lecturer
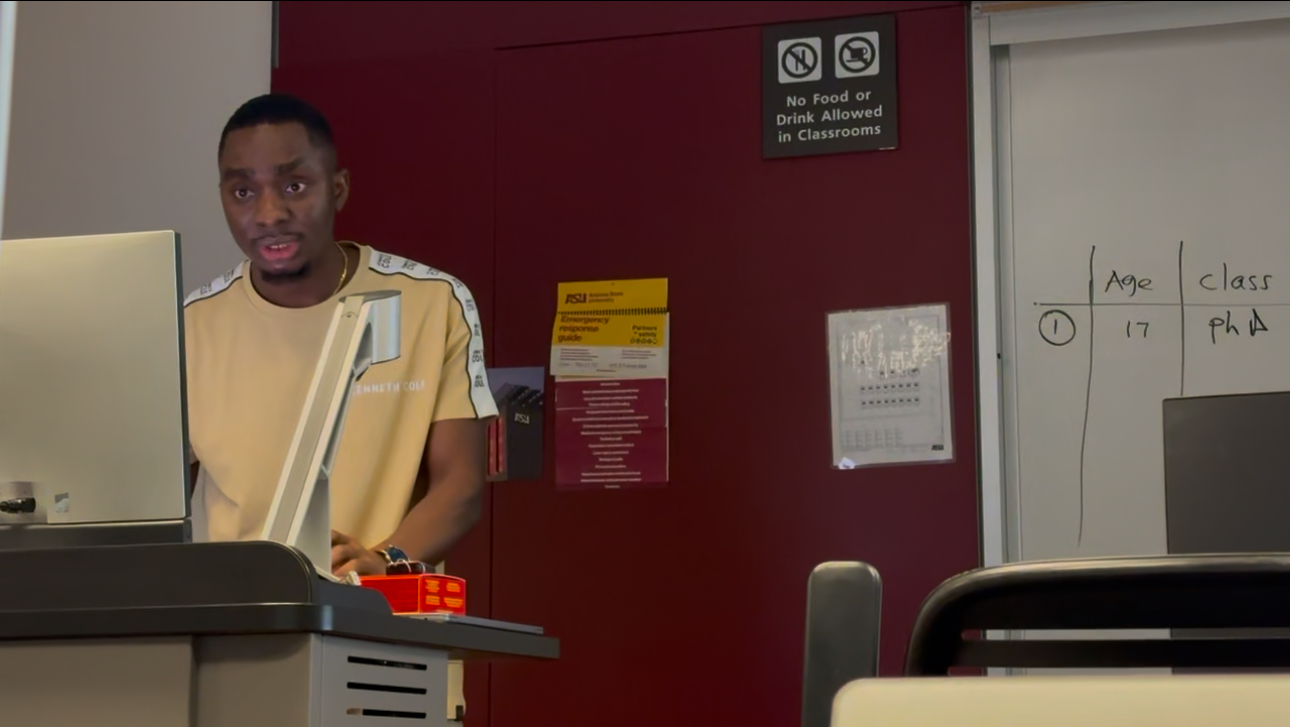
For some modules across the semester, I led the full class session including both the theory and the lab. I prepared the lecture materials, sequenced the content, and managed the classroom from start to finish. Standing at the front of a graduate-level statistics class and making variance intuitive before the software portion is a different kind of pressure than the lab, and I found it clarified my own understanding considerably.
Grader & Feedback Writer
I graded all assignments across the semester, 1300 total points worth of problem sets, descriptive statistics assignments, correlation tasks, and the final take-home assessment. I wrote specific, actionable feedback on every submission. When students confused standard error with standard deviation, or ran the wrong test for their data type, I explained why it mattered, not just what the correct answer was.
What I Taught Across 19 Modules
The curriculum ran the full content of applied quantitative methods, from reading a frequency table to running a factorial ANOVA in SPSS. Click any cluster to see the modules and what I covered in the lab for each.
- M1Statistics or Sadistics? Foundations of statistical thinking, types of data, and why this matters for research SPSS
- M2Computing averages: mean, median, and mode; when each is appropriate and how to run and read descriptive output SPSS
- M3Understanding variability: range, variance, standard deviation; building intuition for spread before hypothesis testing SPSS
- M4Creating graphs: histograms, bar charts, box plots, and scatter plots; I ran the full graphical output session in SPSS and discussed when each visual tells a different story SPSS
- M5Correlation coefficients: Pearson r, interpretation, and the classic lesson that correlation is not causation; students computed r by hand and then reproduced it in SPSS SPSS
- M6Reliability and validity: internal consistency (Cronbach’s alpha), construct validity, and why measurement quality matters before any inferential test SPSS
- M15Testing relationships using the correlation coefficient: deeper dive into bivariate relationships, scatterplots, and regression setup SPSS
- M7Hypothesis testing: null and alternative hypotheses, directional vs. non-directional tests, threats to validity SPSS
- M8Probability and the normal distribution: z-scores, the bell curve, and probability as the engine behind every statistical test SPSS
- M9Statistical significance: what p-values mean, what they do not mean, and why this distinction is more important than most textbooks admit SPSS
- M10One-sample z-test: comparing a sample mean to a known population value; running the logic step by step SPSS
- M11Independent samples t-test: comparing the means of two unrelated groups; I ran this module as a full lecture and lab SPSS
- M12Paired samples t-test: pre/post and matched-pairs designs; directly relevant to how survey experiments are analyzed in UX research SPSS
- M13One-way ANOVA: comparing three or more group means, F-statistic, post-hoc tests SPSS
- M14Factorial ANOVA: two-way designs, main effects, interaction effects; I walked through interpreting interaction plots by hand and in SPSS SPSS
- M16Linear regression: simple regression, interpreting coefficients, R-squared, and running the full output in SPSS SPSS
- M17Chi-square and non-parametric tests: tests for categorical data and what to do when normality assumptions cannot be met SPSS
- M18Other important procedures: factor analysis, special topics in regression, and distributional considerations SPSS
- FinalTake-home final assessment: I graded every submission and wrote detailed APA-format feedback on statistical write-ups
What I Did in the Labs Every Week
Reading about a t-test is not the same as watching your own data produce one. The lab portion of every session was where the concepts either clicked or fell apart, and my job was to make them click. Here is what I covered across the lab curriculum in SPSS:
From the Classroom to the Research Lab
The parallel between teaching stats to anxious graduate students and doing quantitative UX research is direct. In both cases, I am the person who understands the numbers and has to make them legible to people who do not. The stakes are just different on each side of the table.
From the Classroom
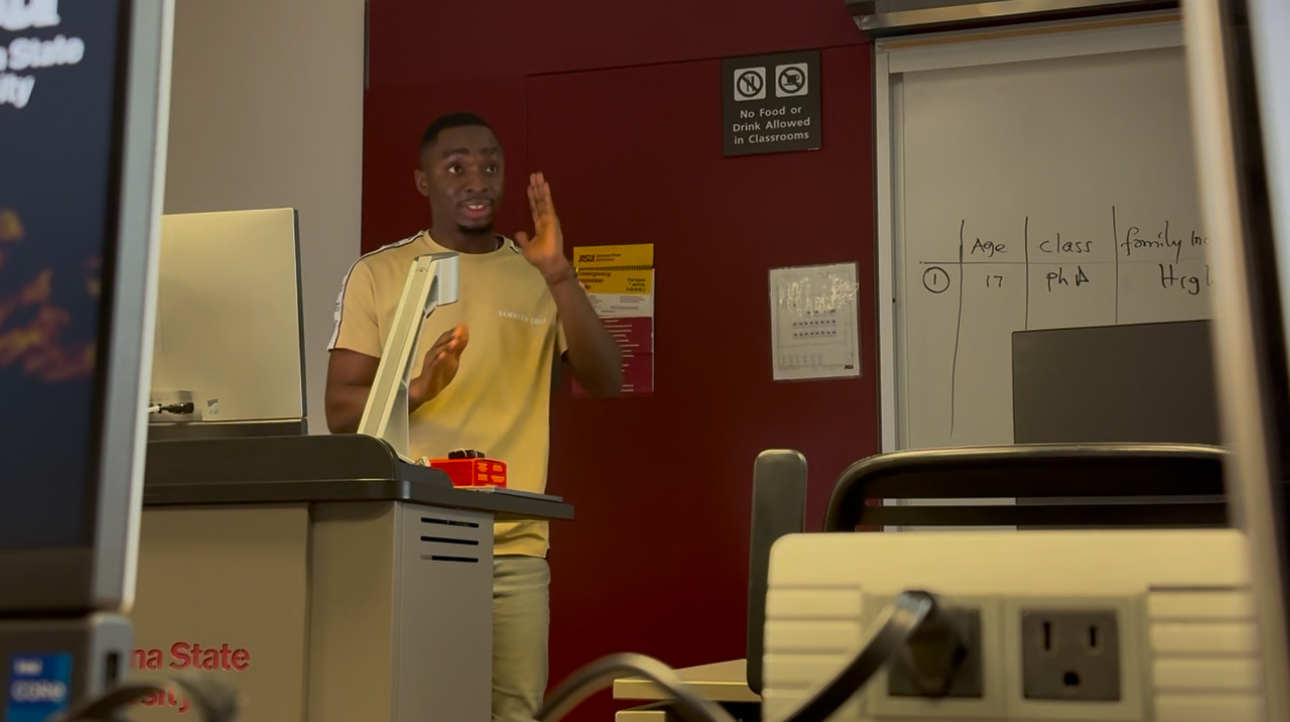
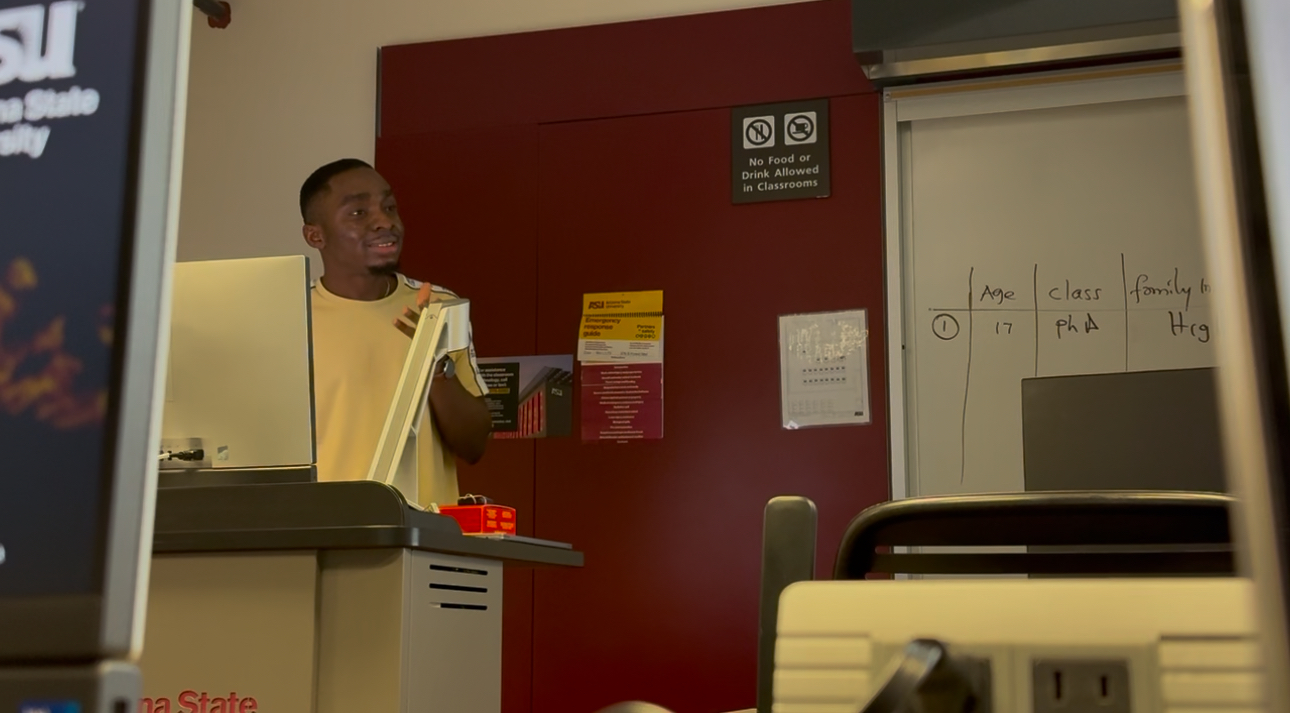
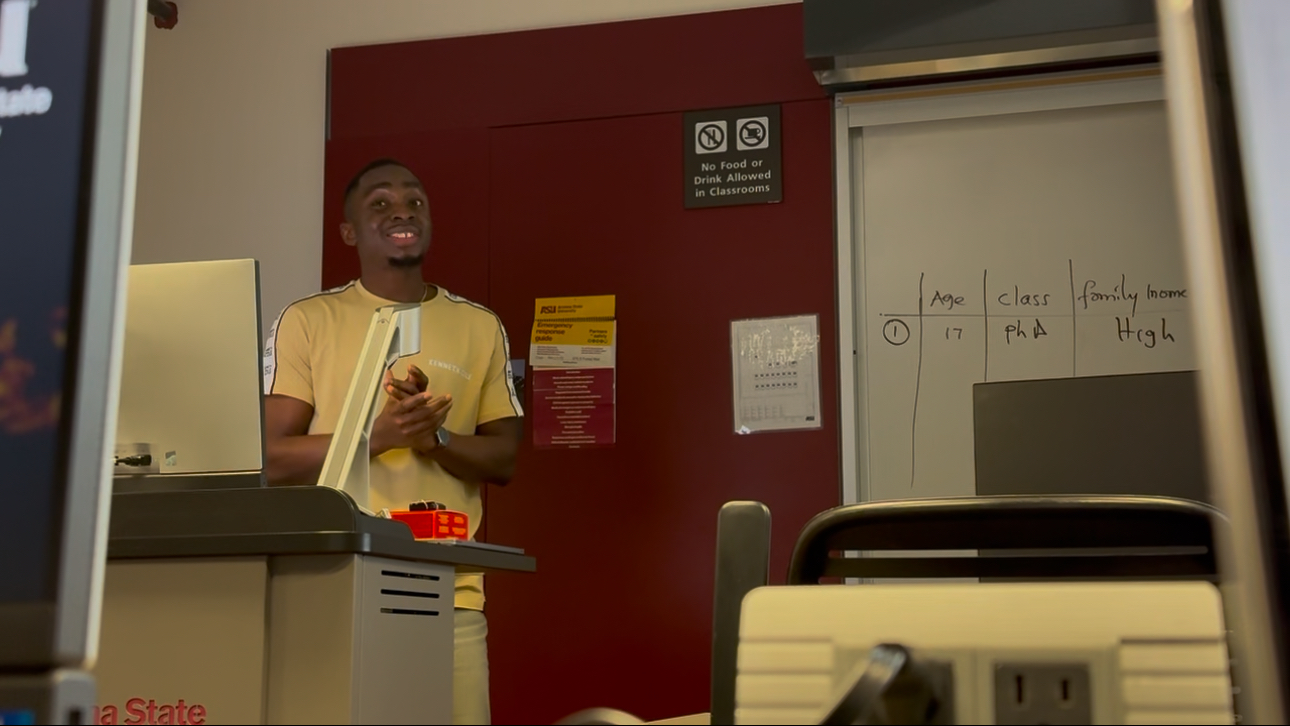
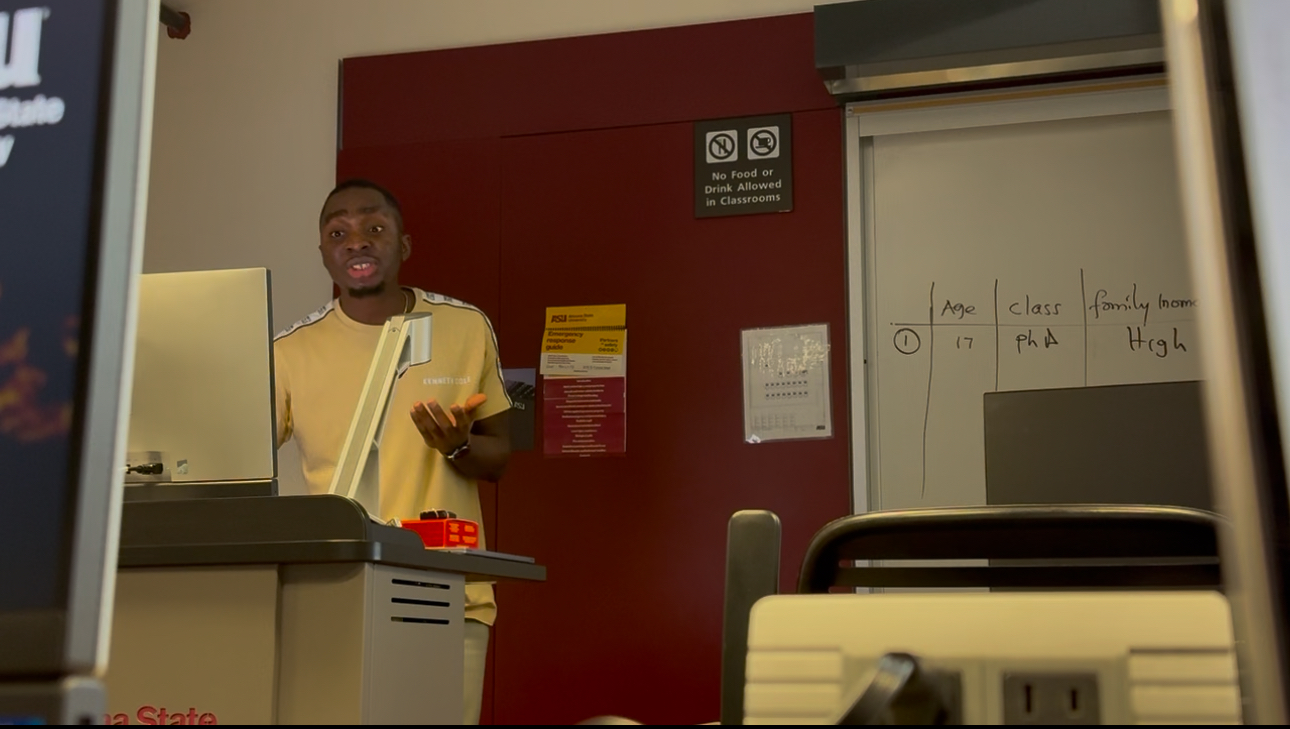
Hover any photo for context. Six images from the classroom sessions I led during Spring 2025.

What I Take From This
The best thing about teaching statistics is that it forces you to understand your own assumptions. Every time I stood in front of that room and someone asked why, I had to actually know. Not just know how to run the procedure, but know what the procedure was doing and why it was the right one. That is the same standard I hold myself to in research.
There is something specific about being responsible for how other people understand quantitative methods that sharpens your own command of them. I noticed this most when grading. Reading a student’s incorrect interpretation of a significant result and having to explain the error precisely enough that they would not make it again, that is a different kind of understanding than knowing the right answer yourself.
I also got a genuine appreciation for what it means to communicate statistics to people arriving from different disciplines and different levels of comfort with numbers. Masters and doctoral students from multiple colleges, many with no prior stats coursework, had to be met where they were. Earning their engagement required making the content feel useful, not just rigorous. That is exactly the challenge in UX research: not impressing statisticians, but giving PMs and designers enough of the right quantitative context to make better decisions.
The SPSS expertise I built here is directly transferable to any analysis environment. The thinking habits it reinforced, choosing the right test, questioning your assumptions before interpreting output, writing up findings with appropriate caveats, those are not software-specific. Importantly, I also use R (and packages) and Python (and libraries) for data science and machine learning projects; but the foundational statistical knowledge never changes even though the tool may change.
Let’s Talk
I am actively looking for UX Researcher or Research Scientist roles and would be happy to connect. Reach out at eadeloju[at]asu[dot]edu and visit my homepage to see my full CV and other work.
View My Homepage & CV Get in Touch