Program Evaluation
This is a mixed-methods program evaluation where I co-developed survey instrument with the team, ran full statistical analysis in R, conducted focus group research, and instructional artifact review across a full academic year with a national cohort of educators.
Xplorlabs Educator
Fellowship
How the Strands Connect
Three independent data streams, each answering a different kind of question about the adoption journey, funnel into a single synthesis. The diagram draws itself as you scroll to it.
Product Evaluation Researcher
I was involved in the program from day one and present at key events as a member of the cross-institutional evaluation team at Arizona State University, observing the fellowship unfold in real time, while simultaneously co-designing the instruments to measure it. That dual position is both a methodological advantage and a discipline problem: I saw things none of our surveys captured and neither did the interviews help. What eventually helped was my active engagement with the participant every step of the way. I had sufficient context for most of the questions that made us scratch our heads.
My responsibilities included the full product research lifecycle including but not limited to co-authoring the evaluation logic model to running analysis pipelines and writing the final stakeholder report. I will now share what my experience was like:
What Each Method Was Built to Answer
I organized my inquiry across four dimensions of the educator adoption experience: Confidence, Attitudes, Knowledge, and Application. Each method was chosen because it addressed something the others could not. Click or tap a segment to explore what each method covers.
Select a segment or a method in the legend to see what dimensions it covers and how I used it.
Twelve Months of Data Collection
Click a phase to see what data collection and product research work I did at each stage.
Running the Numbers & the Themes in Parallel
Both strands ran simultaneously, each informing how I interpreted the other. The quantitative data showed what changed in educators’ work using the platform. The qualitative data told me why it mattered to the people living through it.
Instrument adaptation. I worked with the team to map T-STEM’s existing items to the Fellowship’s content domains (safety science, sustainability, Action-Oriented Pedagogies, and platform resources) and co-wrote new items for constructs the original scale didn’t cover. This required reading the program’s logic model alongside the instrument’s validation literature to make principled decisions about what to preserve and what to adapt.
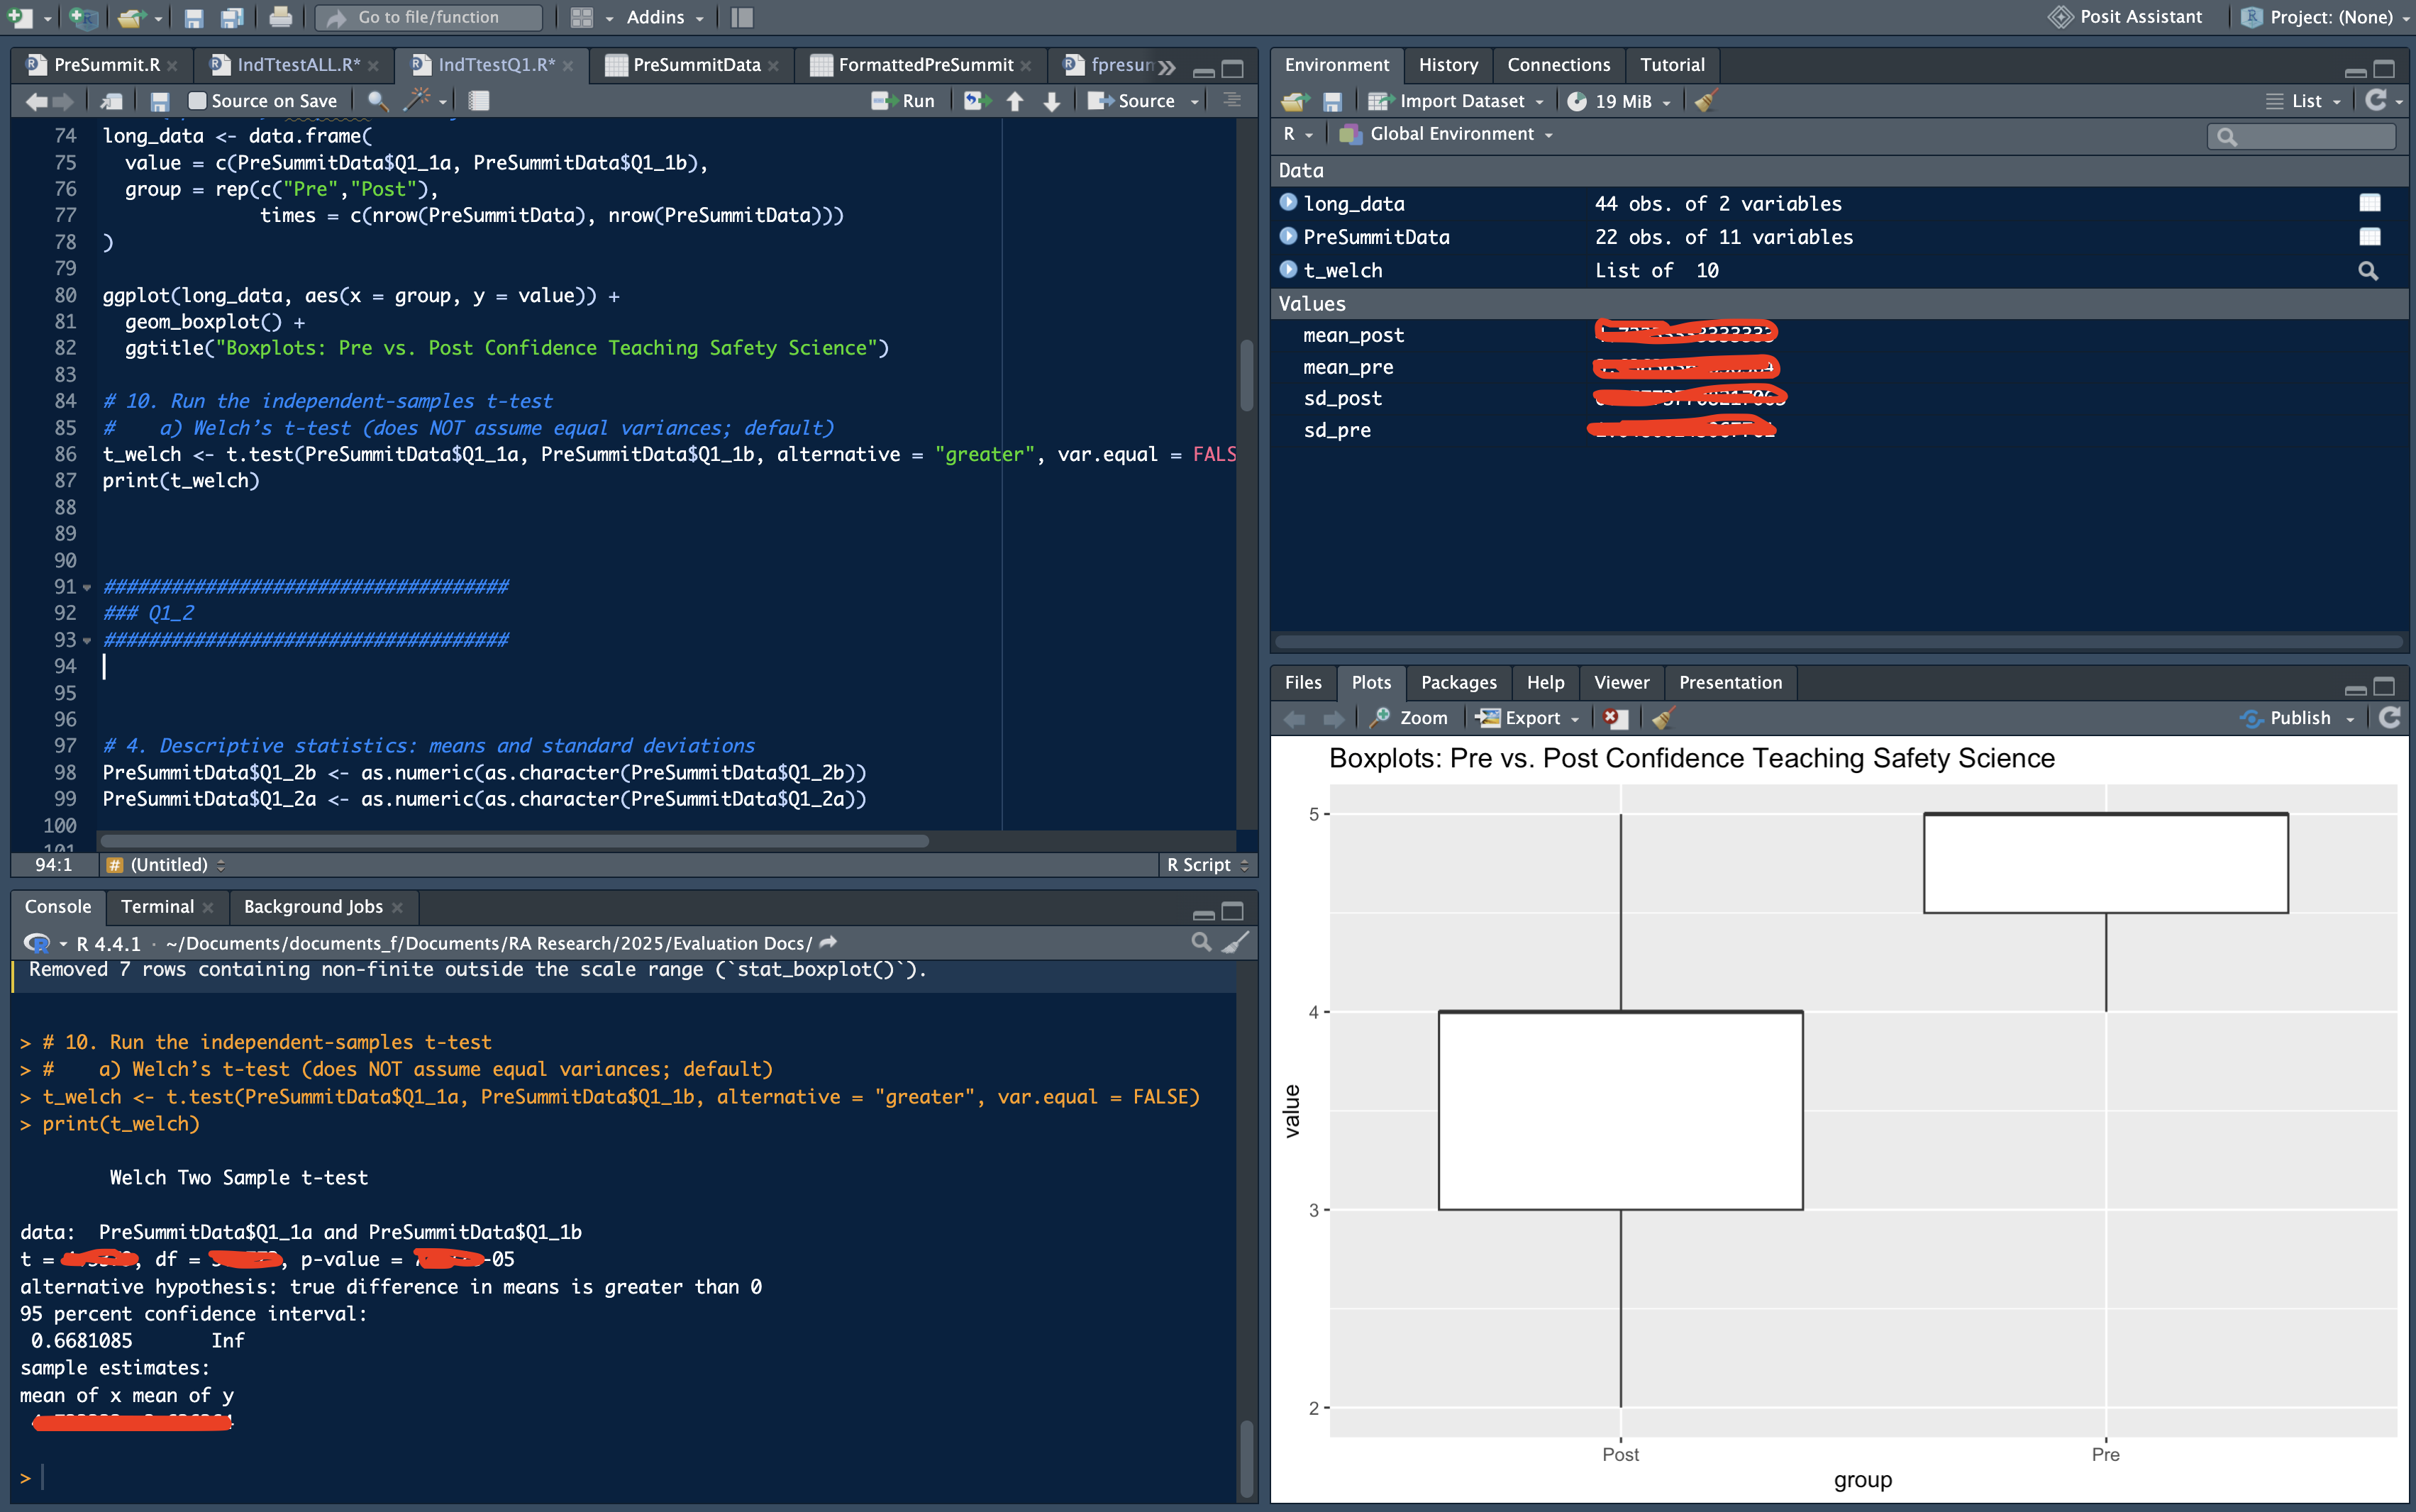
Statistical pipeline. After discussing with my supervisors and presenting the analysis techniques I would suggest, I went on to use Welch’s independent samples t-test because it does not assume equal variance, which of course was a more defensible choice for this participant profile than the standard alternative. Before running any inferential tests, I generated descriptive statistics and exploratory boxplots to examine distributions and flag anomalies that could affect interpretation.

R environment: survey data pipeline, Welch’s t-test code, and a pre/post confidence boxplot. Statistical values redacted.
Reflexive thematic analysis. I applied Braun & Clarke’s six-phase framework to all focus group transcripts. This requires deep engagement with the data at every step and a willingness to return to earlier phases when new readings reveal patterns underweighted the first time.
- Familiarization: Multiple transcript readings before any coding. Resisting premature closure.
- Initial coding: Line-by-line inductive coding across the full dataset.
- Generating themes: Organizing codes into candidate themes that captured dataset-wide patterns.
- Reviewing themes: Testing each theme against the data; merging where distinctions weren’t analytically meaningful.
- Defining & naming: Articulating the core meaning of each theme precisely enough to write about consistently.
- Writing up: Producing the analytic narrative organized by evaluation question.
Artifact analysis served as the third lens, coding educator-produced instructional documents across multiple versions per participant to trace how their platform integration evolved. When survey and interview data told different stories, the artifacts provided the third point of evidence that resolved the tension, or confirmed that both patterns were real in different participant subgroups.
Coding Scheme
Built from the logic model, with dimensions including content alignment, pedagogical approach, and platform resource integration.
Longitudinal View
Multiple document versions per participant traced how instructional thinking changed through the adoption arc.
Triangulation Role
Used to test and refine interpretations from the survey and interview strands before finalizing any conclusion.
The Translation Problem
The hardest part of product evaluation is not analysis. It is translation, the work of converting patterns observed in data into recommendations specific enough to be actionable yet grounded enough to be credible. The distance between “here’s what the data shows” and “here’s what the program and product team should do differently” is where most evaluation reports quietly fail.
I approached this by organizing the synthesis around each evaluation question, assembling evidence from all three strands before drawing any conclusion, then framing recommendations explicitly in the program’s own logic model so stakeholders could engage with them without having to re-learn the research vocabulary.
Convergence across strands raised my confidence in a pattern. Divergence prompted investigation: did two sources disagree because they were measuring different things, or because one had a limitation the other did not? The answer shaped both the conclusion and the recommendation that followed it.
Recommendations were written to influence program strategy, naming what to change in the platform’s onboarding model, what to sustain, and what to examine more closely in the next adoption cycle. The goal was to give decision-makers evidence they could act on, not just a report they could file.
Presenting to the People Who Make the Decisions
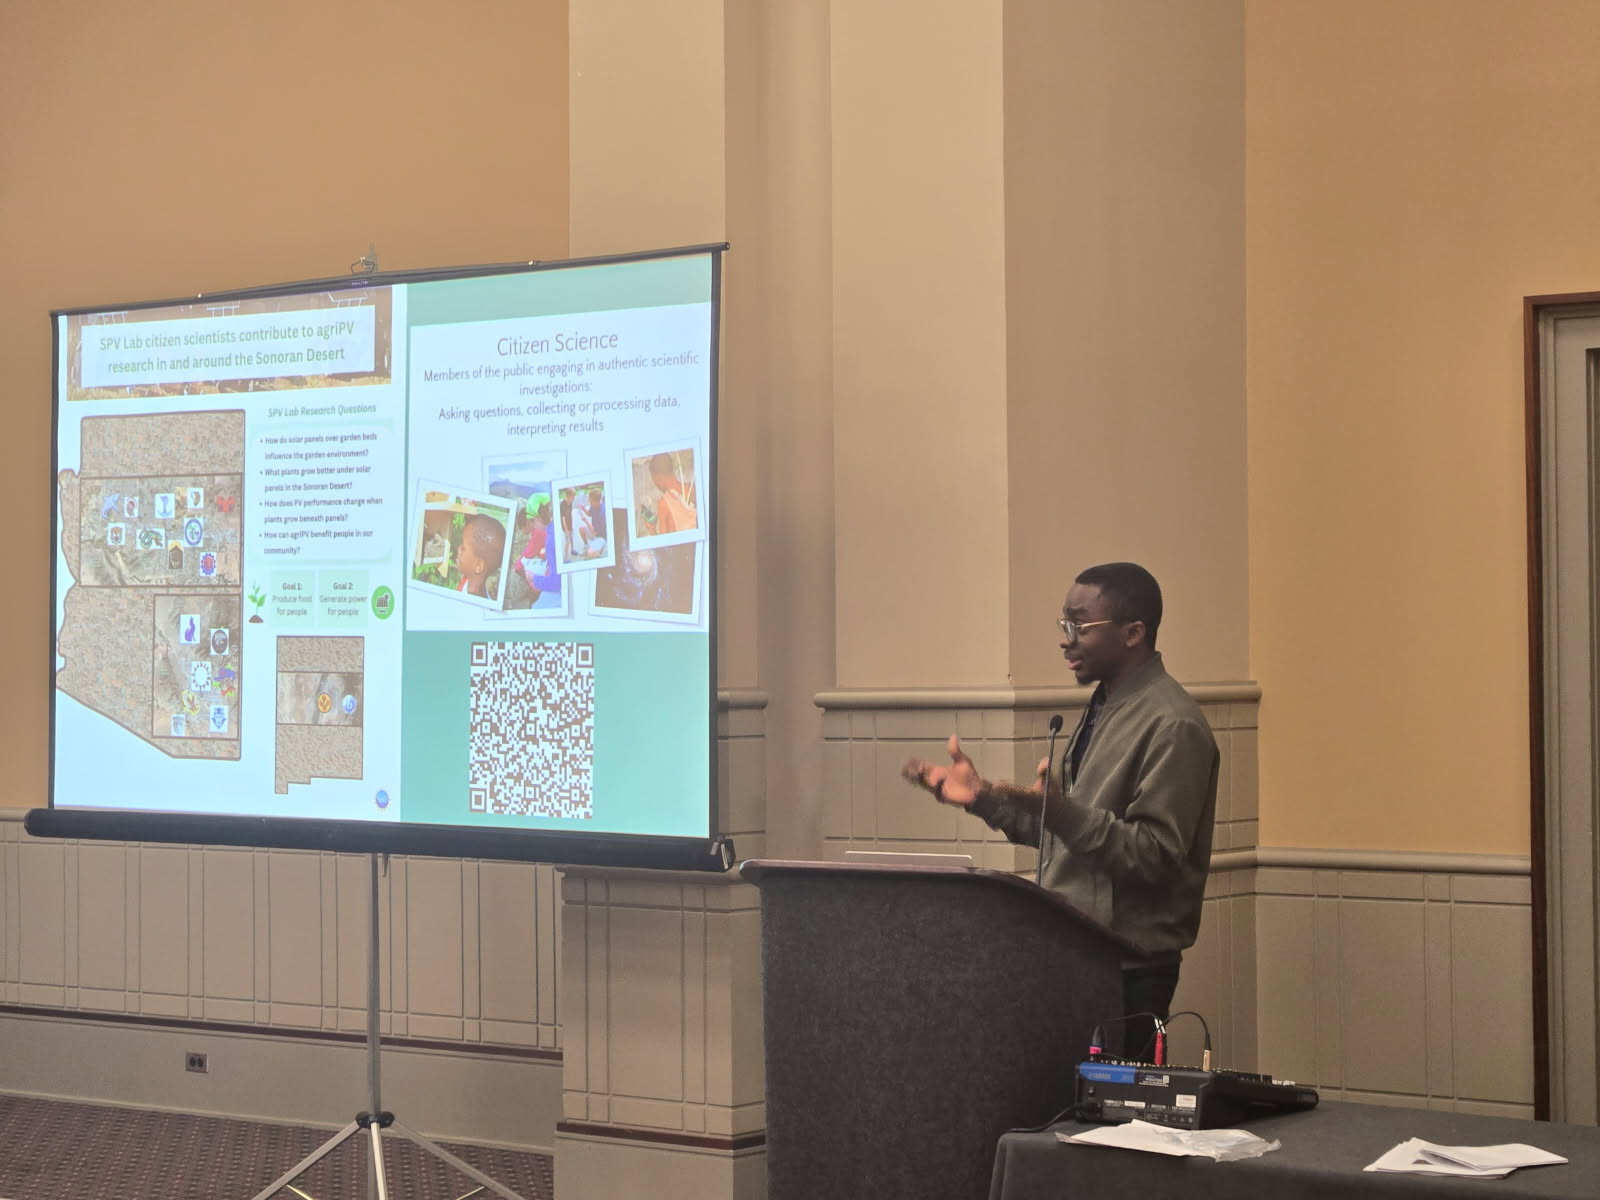
The final evaluation was prepared for product and program leadership. This required a deliberate translation step, moving from the vocabulary of research methods to the vocabulary of product design and program improvement. Importantly, different participants applied what they learned from the fellowship in their unique context, as such, the presentation images (left panel) while still about safety science, does not immediately look like it without checking other slides.

Giving a presentation as AZSTA, Mesa, Arizona.

Also presenting alongside participants at NSTA in Philadelphia.
I focused the stakeholder presentation around the evaluation questions and logic model that had framed the work from the beginning. Where the data told a more complex story than a clean summary would convey, I made that complexity explicit and showed what it meant for future product and program decisions in the form of recommendations. Unfortunately, I cannot share the findings and will leave this section here.
From the Field
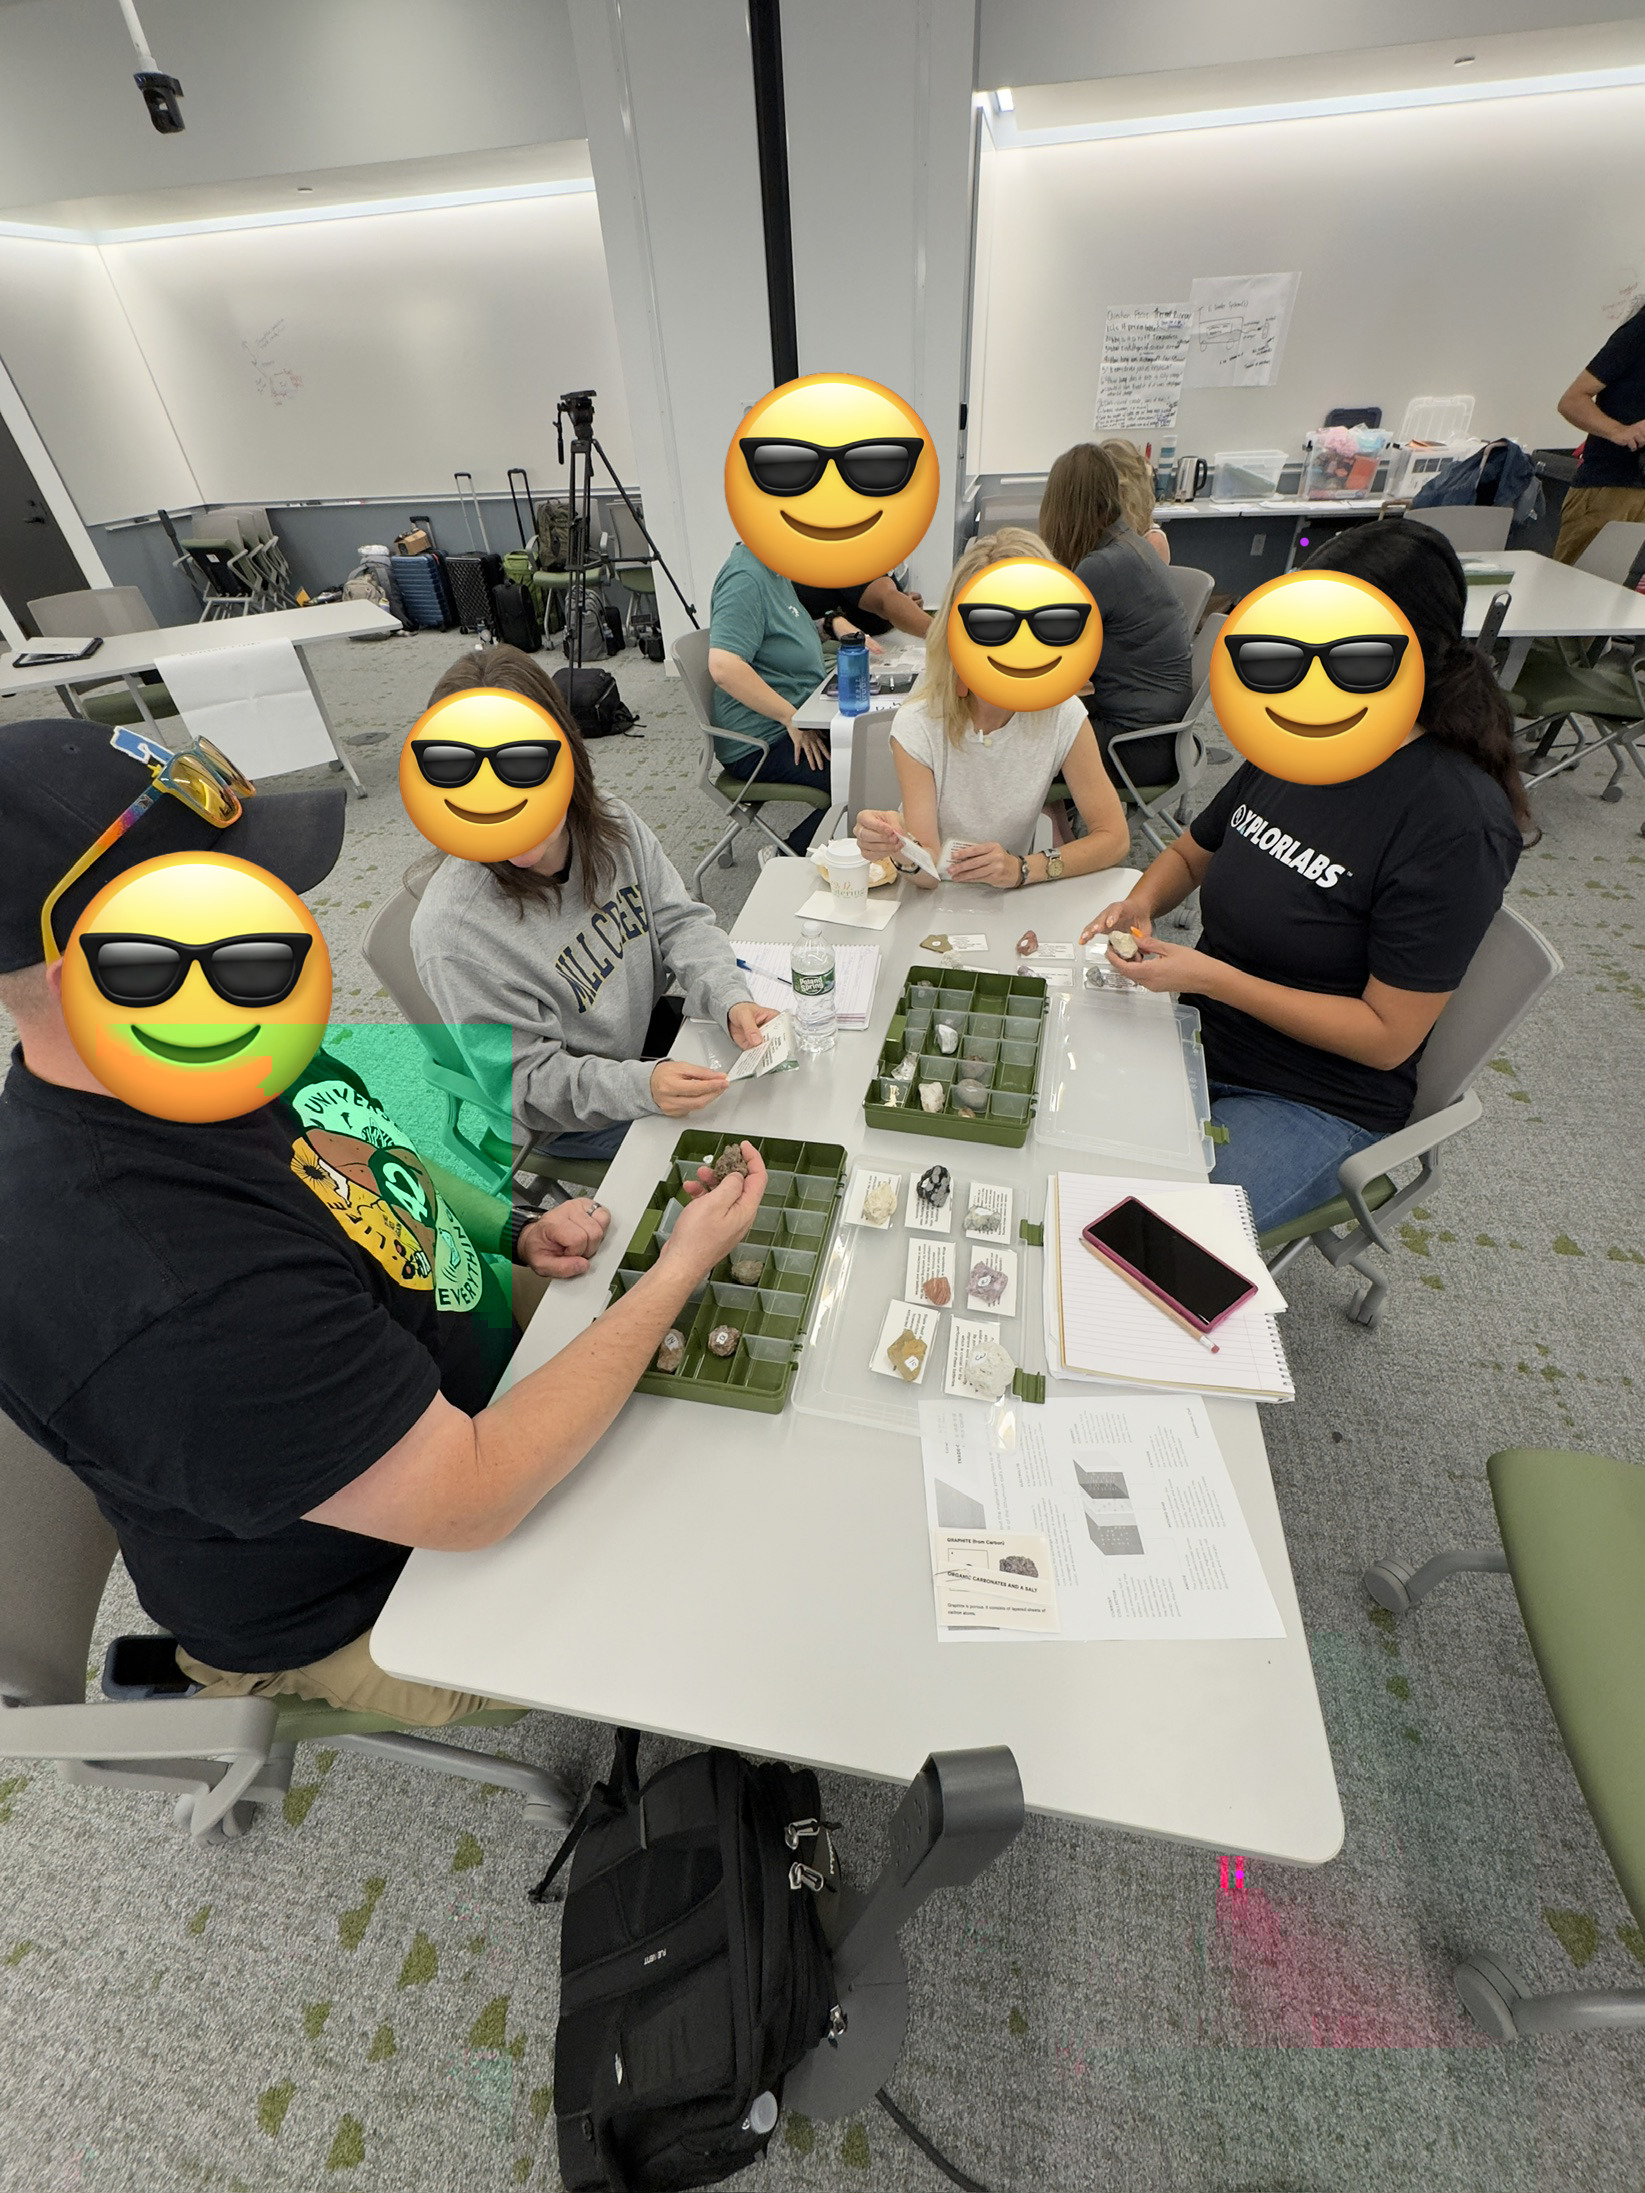
Hover any image for context. Participants’ faces obscured where applicable.

What I Carry Forward
Product evaluation is user research with higher stakes and a harder audience. The participants are the users. The platform is the product. The logic model is the research question. The report is the deliverable. The job, in every case, is to understand people well enough to say something useful about them, and honest enough to say it even when it complicates the story the product team came in hoping to hear.
This project clarified something I had suspected but not tested at this scale: the decisions that most shape an evaluation’s validity are made before any data is collected. Which constructs to measure, which instrument to adapt, what to observe rather than quantify. Those choices ripple through everything that follows. Getting them right requires genuine familiarity with the product and its adoption context, not just command of the methodological toolkit.
Running quantitative and qualitative pipelines in parallel forces a kind of interpretive discipline you don’t get from either method alone. When the two strands agreed, I gained confidence. Better still, I had less doubt. When they disagreed, I had to sit with the tension until I understood why. That investigation almost always produced a more precise account of the adoption experience than either strand would have suggested on its own. Even when both methods produce contesting results, that could also be valuable, but that was not the case for this project.
While I have led and participated in several month-long projects, this is the longest project I have been fully immersed in all the way; although I was part of the cohort before this particular one I am reporting about and also the one after it; I was not taking leading role in those. This was a one-shot opportunity.
Let’s Talk
I am actively looking for UX Researcher or Research Scientist roles and would be happy to connect. If my work resonates with what your team is building, reach out at eadeloju[at]asu[dot]edu. You can also visit my homepage to see my full CV and other work.
View My Homepage & CV Get in Touch